Data Visualization
Here you can see example time-series of Oithona (small zooplankton assayed by microscopic traverse) abundance for various regions of the NW Atlantic, generated using the CPR-BEAMS BCO-DMO data resource and Matlab scripts presented on the Data Methodology page.
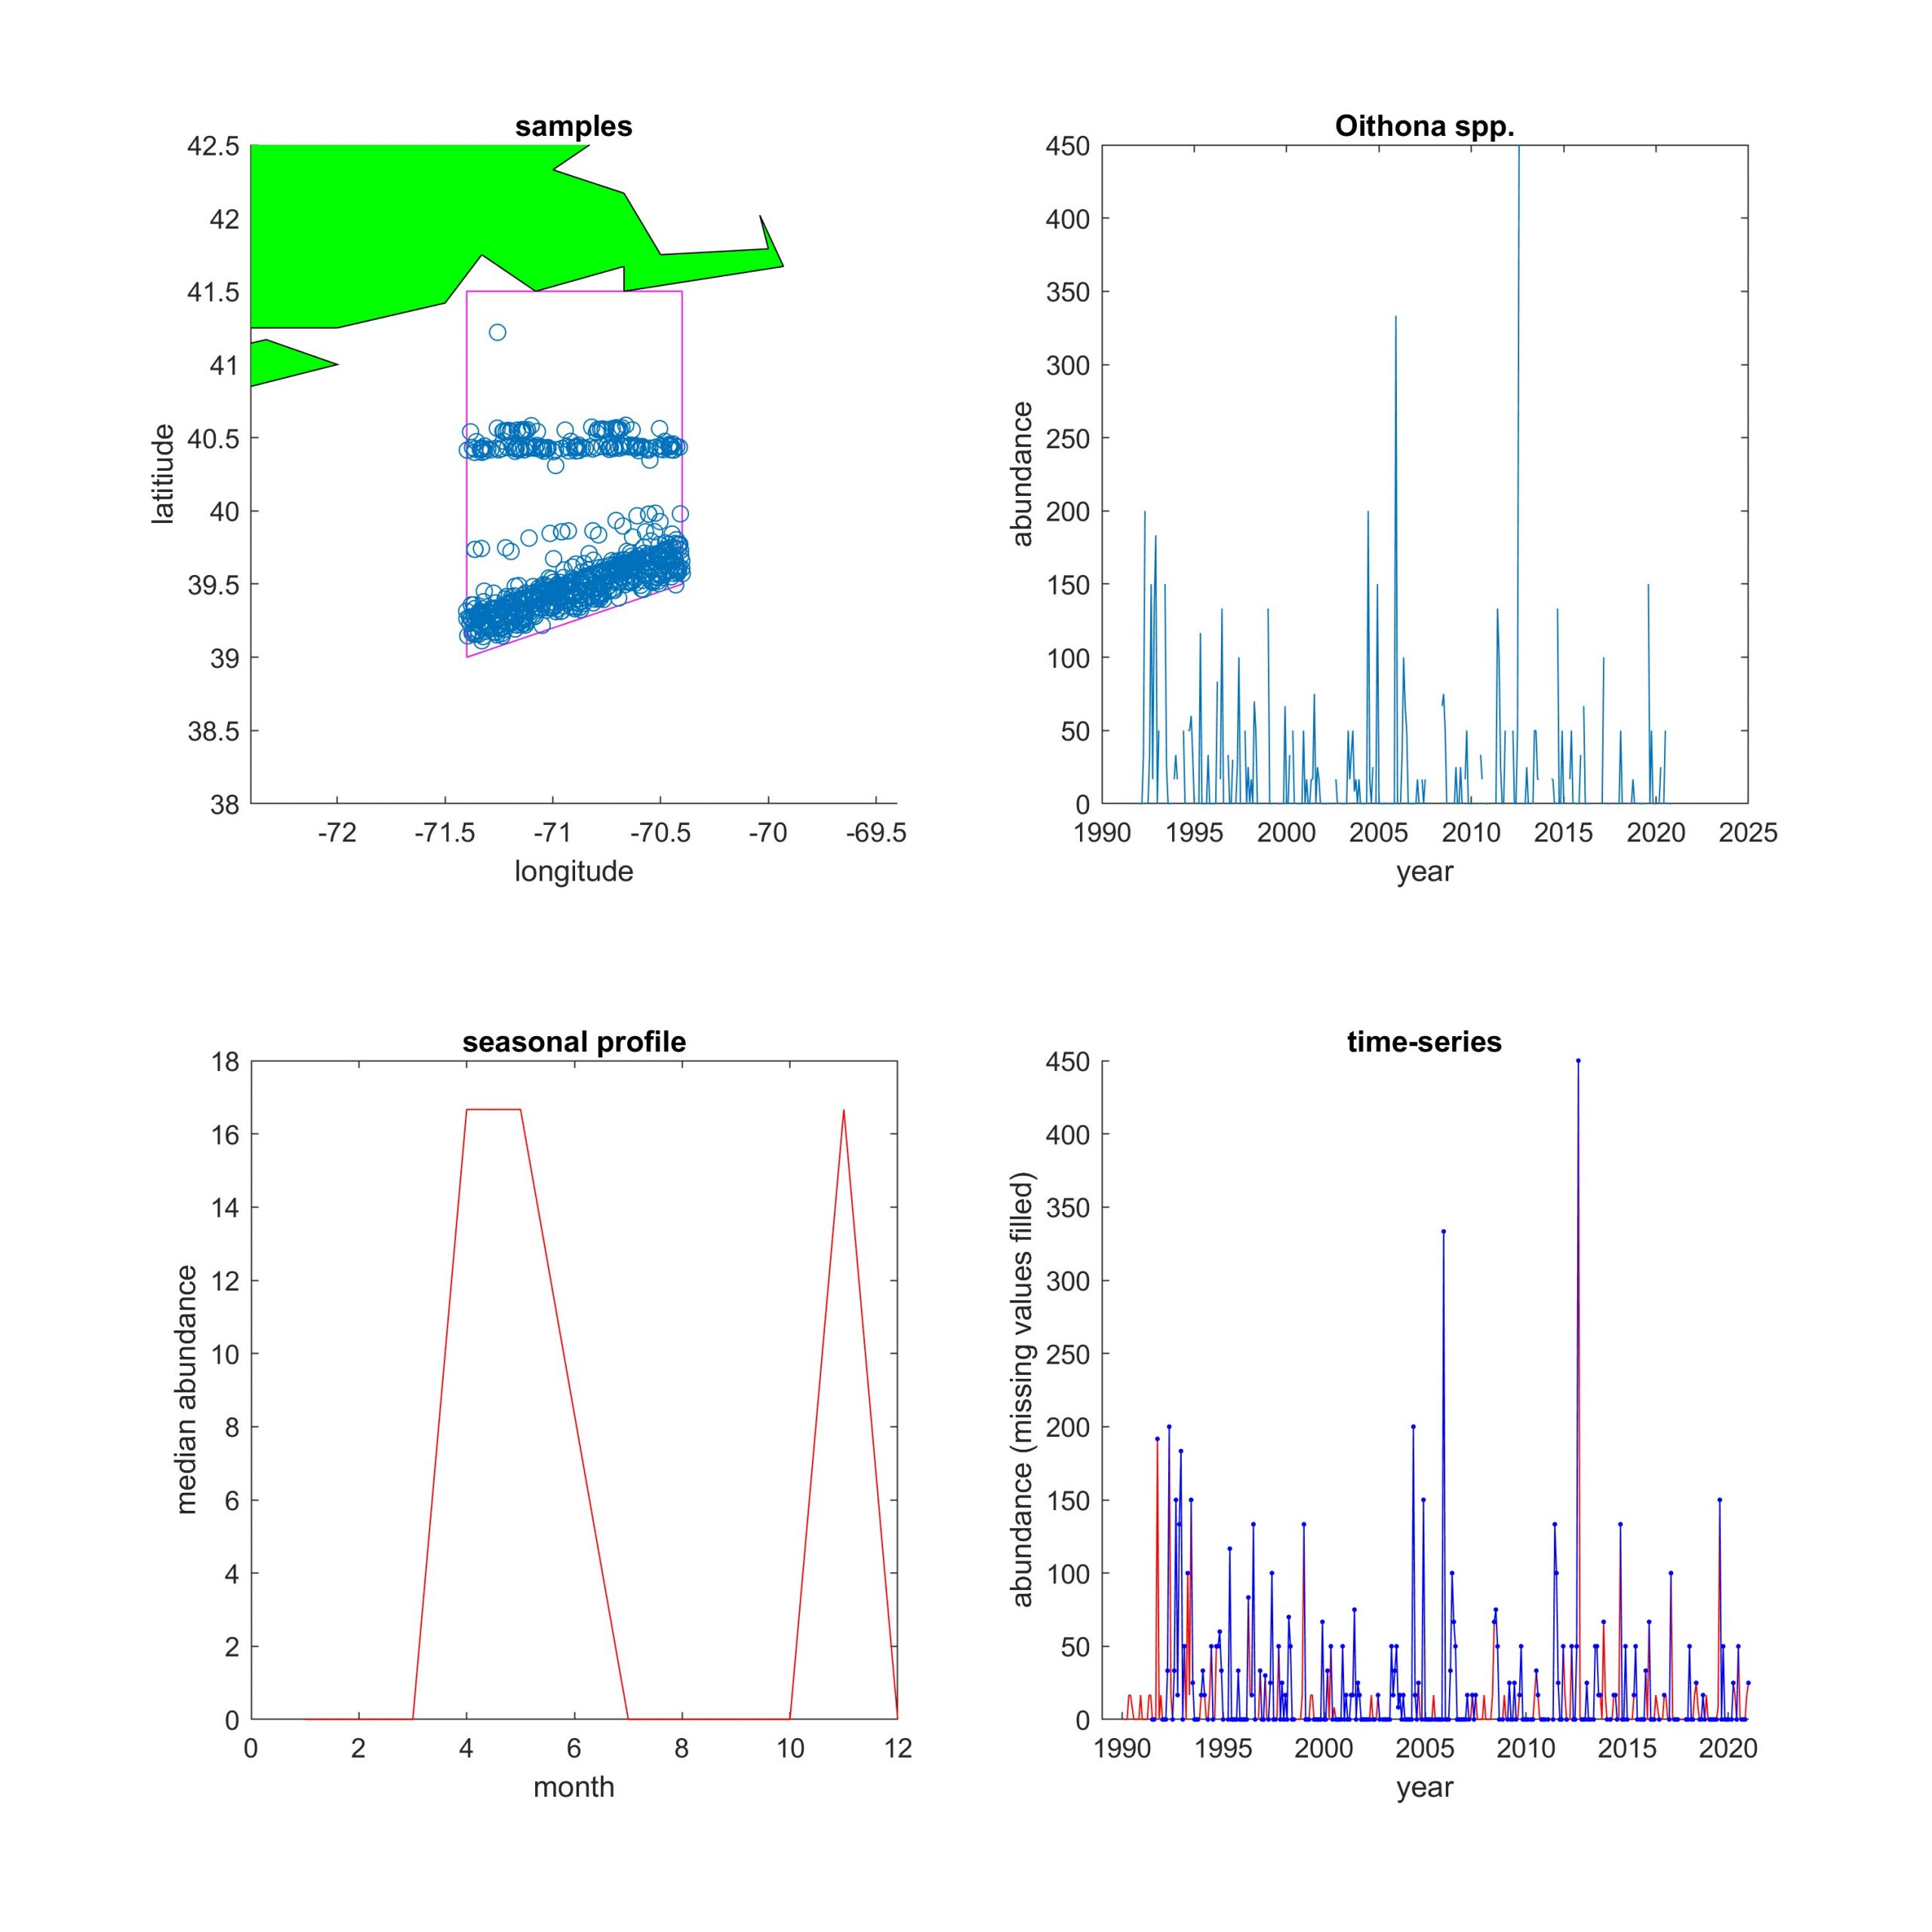
Data from an example Area and Time Range
All CPR samples within a specified area surrounding the NES-LTER from 1990 to 2022 are presented (top left).
Oithona abundance values within the area are averaged to produce monthly values (top right).
The median abundance is determined for each month of the year (bottom left).
Missing monthly abundance values are infilled with median abundance values for that month in red (bottom right) to form a continuous time-series.
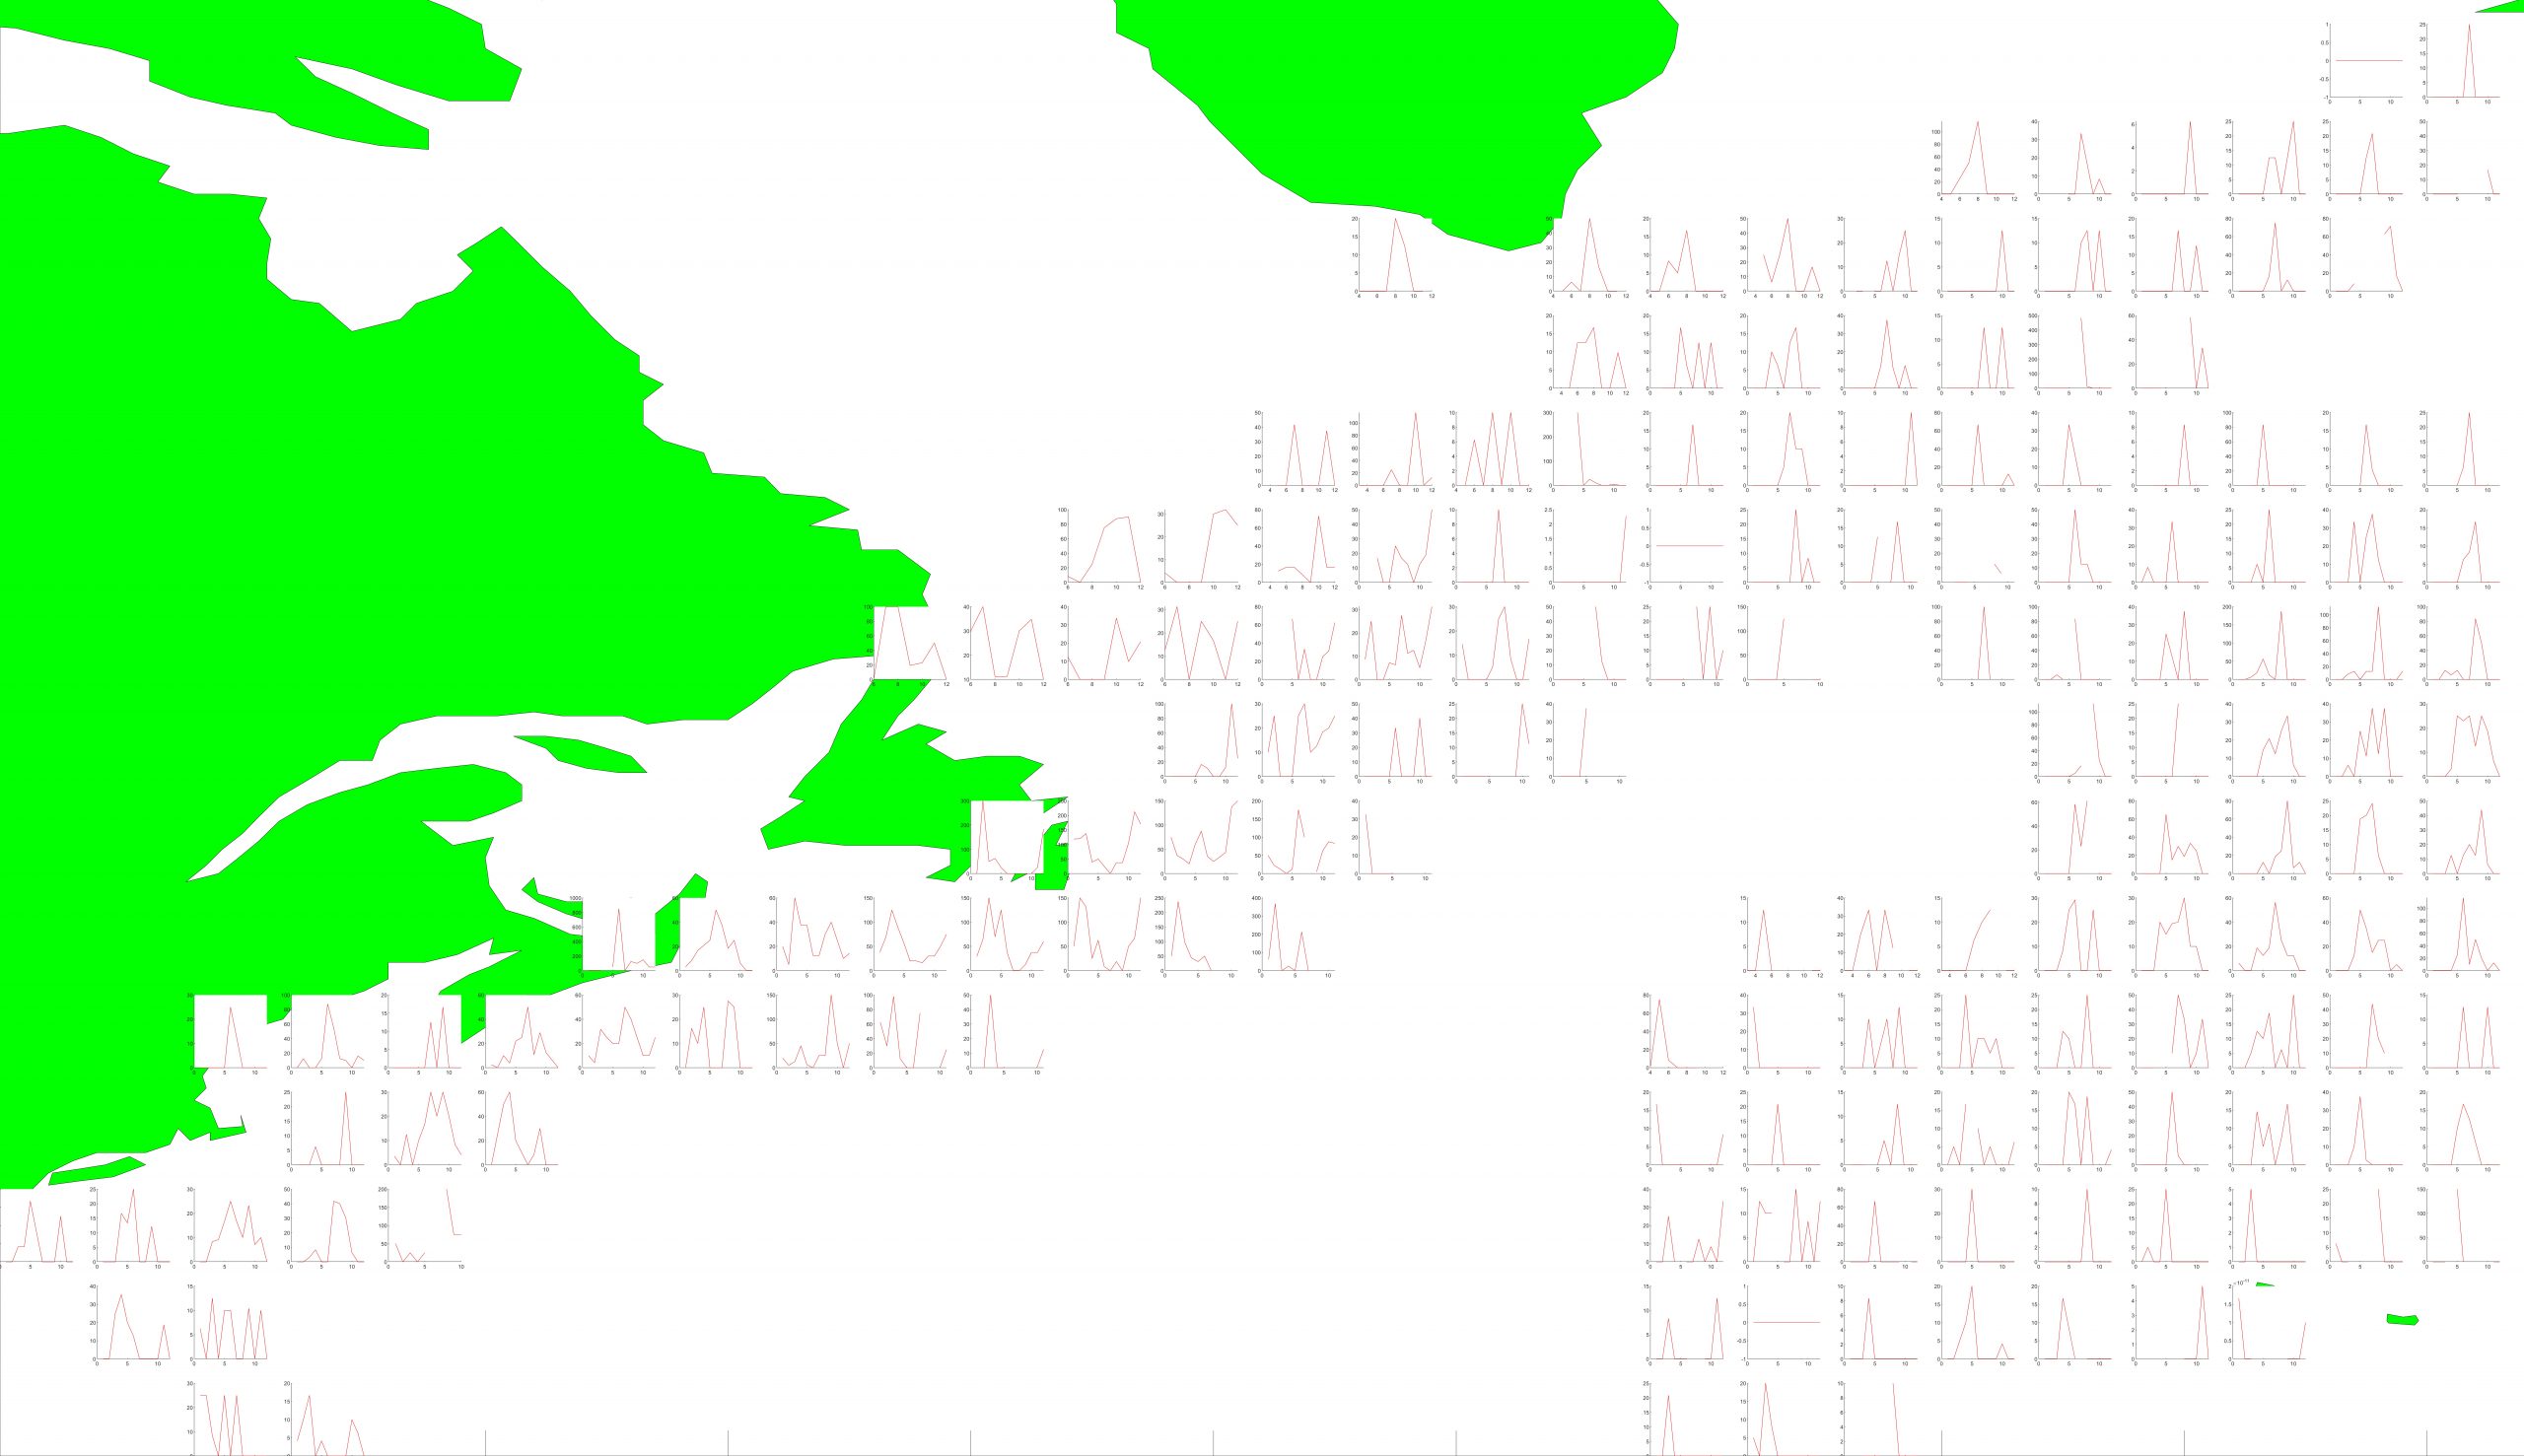
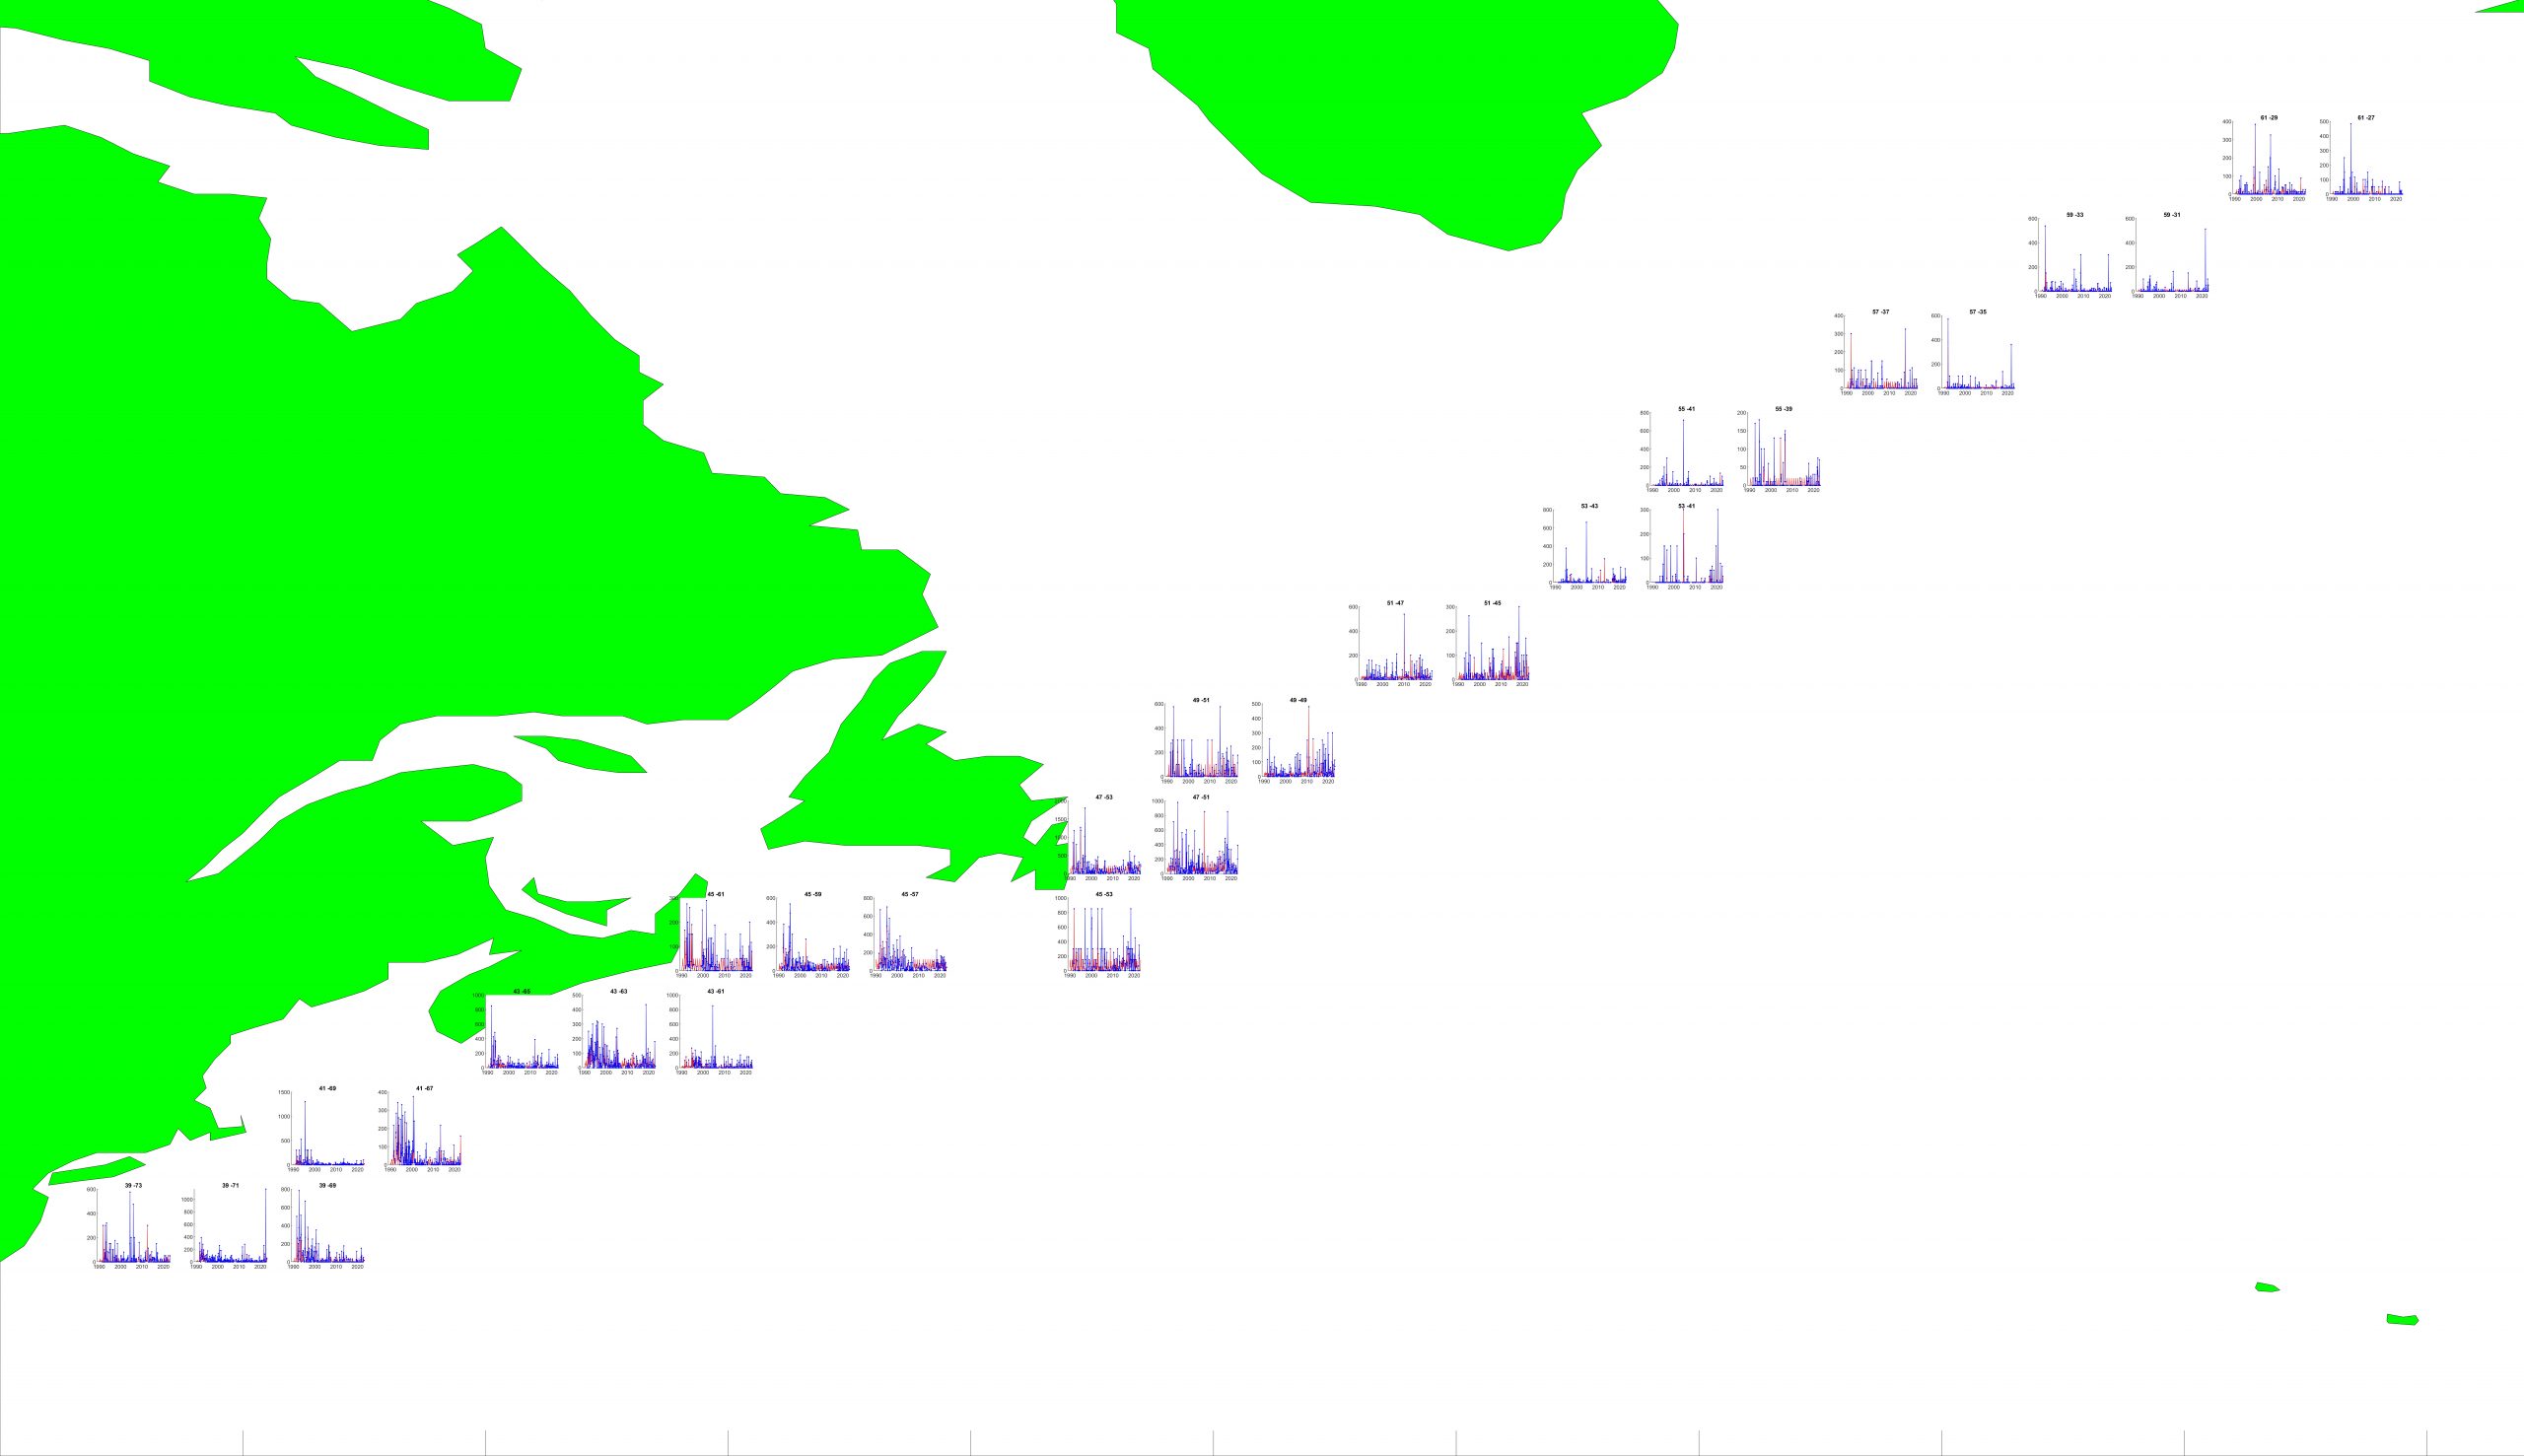
Samples gridded to obtain monthly values
We examine samples within each 2 degree by 2 degree area of the NW Atlantic. All samples in the CPR-BEAMS area from 1990 to 2022 are presented in red. Where samples are available in a majority of months for this period, monthly mean Oithona abundance values are presented for 2 degree by 2 degree areas of ocean. For each 2 by 2 degree area the lower left corner latitude and longitude are given above the abundance plot. We see that regular samples are available from the US/Canadian coast and Z route reaching to Iceland. Click image to enlarge.


