The Geomagnetic Field : Seconds to millions of years
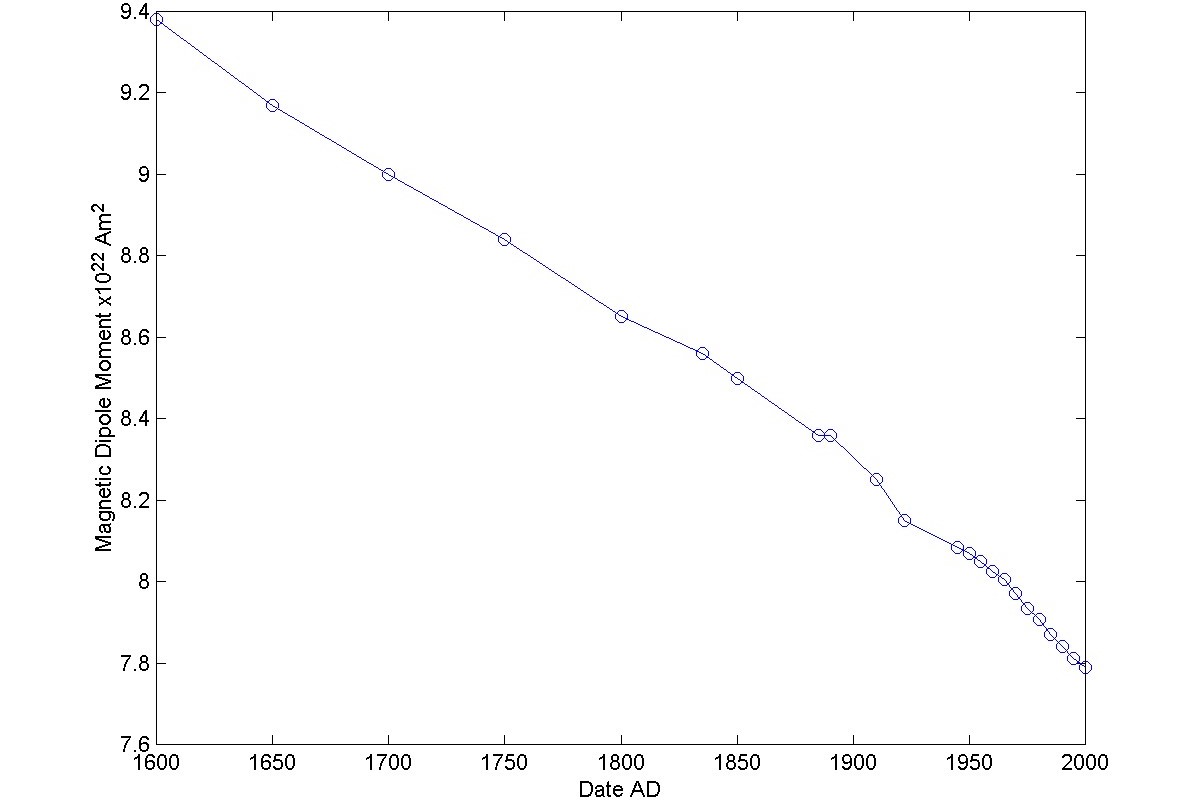
Earth's magnetic field varies on timescales from milliseconds to millions of years. Below are a couple of images of various timescales indicating how Earth's magnetic field has varied in the past. Click on the map menu below of Earth's magnetic field intensity to see how it has changed over the past century. Note the growth of the magnetic low over Brazil and the weakening of the magnetic high in northern Canada. The map is generated from a mathematical model of the geomagnetic field generated from observations.
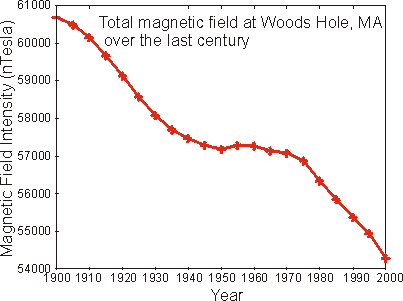
The figure above shows the intensity of Earth's magnetic field at Woods Hole, Massachusetts back to 1900. These are values estimated from a mathematical model of Earth's magnetic field: the International Geomagnetic Reference Field (IGRF) based on satellite and in situ measurements. The IGRF is a spherical harmonic expansion of Earth's magnetic field that is recomputed every 5 years.

