CINAR Research Themes
Highlights for Theme III: Stock Assessment Research
Analysis of Groundfish Catch Rates, PI Steve Cadrin, SMAST
In 2012, the Secretary of Commerce declared a fishery failure and an economic disaster for the New England groundfish fishery. After decades of overfishing from foreign and domestic fleets, rebuilding plans were implemented in the 1990s and a precautionary management system was implemented in 2010. The Annual Catch Limit system substantially reduced allowable catch (e.g., the allowable catch for Gulf of Maine cod decreased 96% over five years, 2011-2015). However, despite these management efforts that strictly adhered to scientific advice, overfishing appears to be continuing for Gulf of Maine cod, Gulf of Maine and southern New England yellowtail flounder, and Georges Bank winter flounder. Several factors contribute to uncertainty in groundfish stock assessments and fishery management, including under-reported catch, decreased productivity from climate change, mortality of fish released from fishing gear, and surveys with limited spatial resolution. The development of standardized fishery catch rates are proposed to provide fishermen’s perceptions of groundfish availability and to help improve stock assessments and fishery management of New England groundfish.
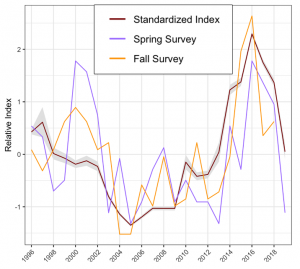
Figure 1: Analysis of Groundfish catch rates
Implications of Resolving a Mismatch in the Scale of Atlantic Cod Fishery Management, PI Lisa Kerr, UMaine
The goal of this research is to evaluate the performance of alternative management procedures that aim to resolve the identified mismatch in the scale of biological population and management units of Atlantic cod. To address this goal, we are applying management strategy evaluation to quantify and compare the performance of various approaches for improving fisheries assessment and management of Atlantic cod. We are engaging with fishery stakeholders, including fishermen and fishery managers in the New England Fishery Management Council (NEFMC) Groundfish Committee, Commercial and Recreational Advisory Panels, state/federal and environmental scientists in the Groundfish Plan Development Team. This approach allows stakeholders the opportunity to provide feedback on our work and propose alternative solutions to address this mismatch in the scale of Atlantic cod fishery management.
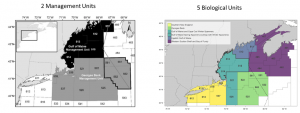
Figure 2: Left panel: Current boundaries for the two U.S. Atlantic cod management units – Gulf of Maine (black polygons) and Georges Bank (gray polygons). The individual polygons are statistical areas, used to aggregate fishery catch data. Right panel: Biological stock structure of cod in the Gulf of Maine and adjacent areas.
Data Synthesis and Reporting: Improving the Understanding of Ocean Acidification in a Multi-stressor Environment, PI Saba, Rutgers
The interaction of ocean acidification (OA) and warming seawater temperature may act to exacerbate organism stress responses. This highlights the need to synthesize available multi-stressor data to better understand their interactive dynamics in the NES, particularly in habitat ranges of recreationally and commercially important species. Using the available sources of OA and ocean temperature data in the NES, this project is developing data synthesis products to be included in the NEFSC State of the Ecosystem (SOE) reports to the Mid-Atlantic and New England Fisheries Management Councils (2025-2027) to provide managers with information on single (OA, ocean temperature) and multi-stressor trends and risks. These synthesis efforts, combining historical and ongoing datasets, will develop regional, seasonally-resolved maps of surface and bottom aragonite saturation state (ΩArag) and ocean temperature to identify single and multi-stressor hotspots. To provide additional insight into potential tolerance to stressors, we will incorporate seasonal chlorophyll climatology as a proxy for food availability into the spatial synthesis. These identified hotspots will be related to sensitivity levels pre-determined in laboratory-based studies for calcifying organisms (molluscan shellfish and pteropods; finfish and other non-calcifying organisms).
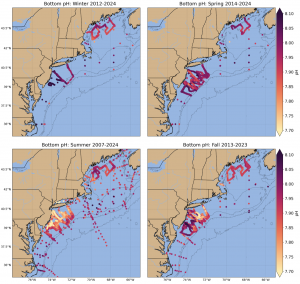
Figure 3: Seasonal bottom pH on the U.S. Northeast Shelf plotted from available quality-controlled vessel- and glider-based datasets. Winter (Dec, Jan, Feb) data availability: 2012-2024; Spring (Mar, Apr, May) data availability: 2014-2024; Summer (Jun, Jul, Aug) data availability: 2007-2024; and Fall (Sept, Oct, Nov) data availability: 2013-2023.